Lars Fischer · 15 October 2026
Examining Color Shifts in Sedge Communities Across Tidal Cycles to Map Biodiversity Hotspots in Coastal Marshes
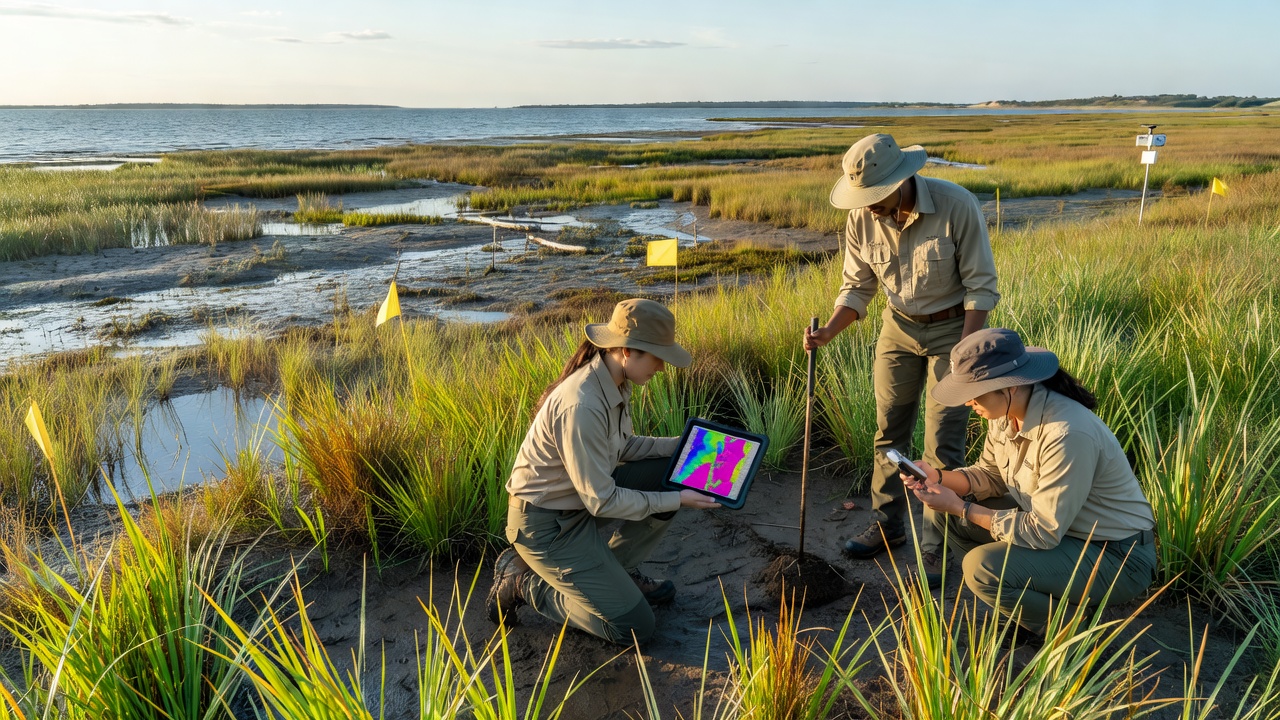
Coastal marshes support dense stands of sedges that respond to tidal flooding through measurable changes in leaf pigmentation and canopy reflectance, and researchers track these patterns to locate zones with elevated species diversity. Tidal cycles expose plants to alternating periods of submersion and air exposure, which alters chlorophyll content and triggers production of accessory pigments such as carotenoids, and these biochemical adjustments register as shifts in visible and near-infrared wavelengths when observed from ground sensors or aerial platforms.
Tidal Influence on Sedge Physiology
Daily high tides deliver saltwater that increases osmotic stress while low tides allow oxygenation of root zones, and sedge species differ in their tolerance thresholds so that community composition shifts across elevation gradients. Studies document that Carex and Schoenoplectus stands display greener reflectance at peak low tide when photosynthesis rates climb, whereas prolonged inundation during spring tides produces detectable yellowing within forty-eight hours. Remote sensing instruments capture these transitions because the red-edge position moves several nanometers as chlorophyll degrades, providing a repeatable signal that field crews calibrate against biomass samples collected at multiple marsh sites.
Remote Sensing Techniques for Color Mapping
Multispectral cameras mounted on drones fly repeated transects timed to coincide with predicted tide stages, and analysts convert raw reflectance values into indices such as the normalized difference vegetation index and the plant senescence reflectance index. Ground-truth plots established along salinity gradients confirm that areas showing the greatest amplitude of color change between neap and spring tides often coincide with higher counts of invertebrate and avian species. Data collected in the Pacific Northwest and the Gulf Coast demonstrate consistent correlations, while similar patterns appear in temperate European marshes where satellite archives extend the temporal record back more than two decades.
Identifying Biodiversity Hotspots Through Temporal Analysis
Long-term image stacks reveal that hotspots maintain stable greenness across a wider range of tidal amplitudes compared with surrounding areas, and this stability correlates with greater microtopographic complexity that supports multiple sedge species simultaneously. In October 2026 a coordinated campaign will deploy hyperspectral sensors across selected Atlantic and Pacific sites to refine these relationships further, building on earlier datasets that already link pigment shifts to soil organic carbon content and pore-water salinity measurements. Observers note that hotspots frequently occur near tidal creek junctions where water exchange mixes nutrients without causing prolonged anoxia, and mapping these locations helps prioritize restoration plots that aim to increase habitat connectivity.
Integration with Field Validation and Regional Datasets
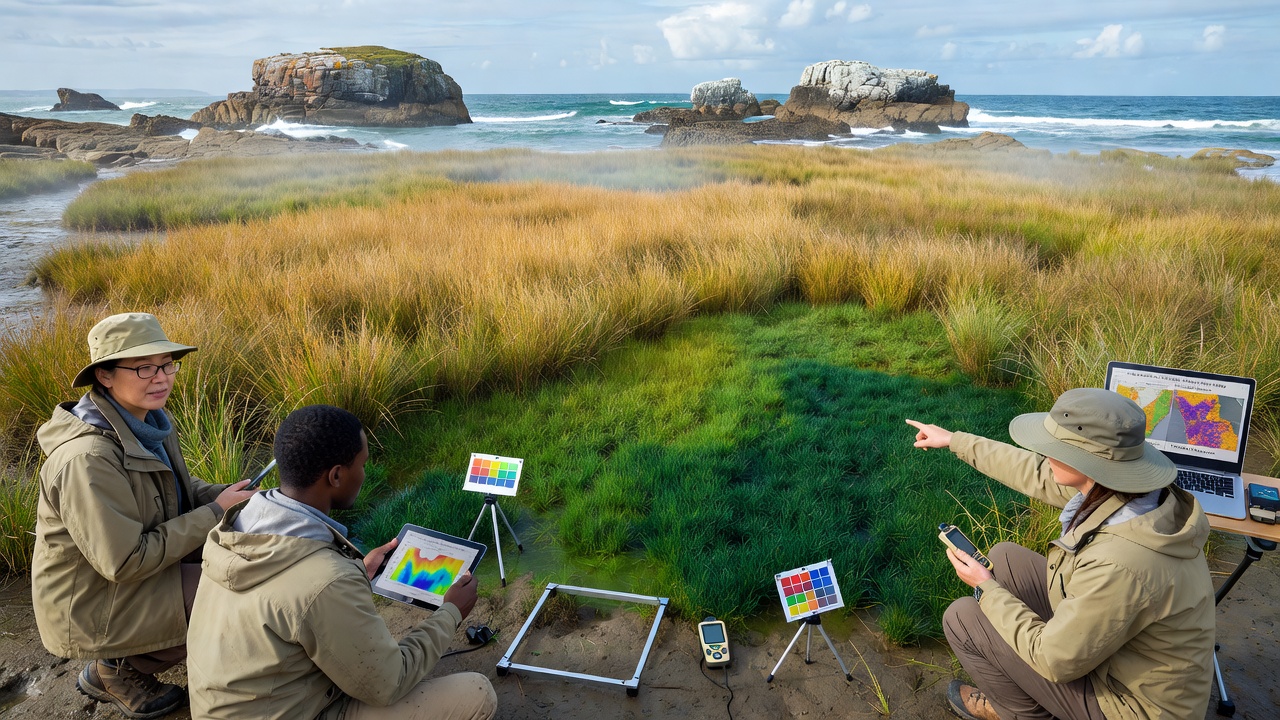
Teams combine spectral data with quadrat surveys that record vascular plant cover, invertebrate density, and bird foraging activity, and statistical models weight the contribution of each variable to overall diversity scores. Reports from the U.S. Environmental Protection Agency document how such integrated approaches improve identification of priority conservation areas along the Atlantic seaboard, while parallel work by Environment and Climate Change Canada applies comparable methods in the Bay of Fundy where extreme tidal ranges amplify color contrast signals. Academic partners supply laboratory assays of leaf nitrogen and chlorophyll a that anchor the remote observations, ensuring that mapped hotspots reflect genuine ecological productivity rather than sensor artifacts.
Applications in Marsh Management and Monitoring
Resource agencies use the resulting hotspot maps to guide placement of sediment nourishment projects and to evaluate post-restoration recovery trajectories, and repeated flights after major storms show whether color-shift amplitudes return to baseline levels within one or two growing seasons. Because the method relies on passive reflectance rather than direct organism counts, it scales efficiently across large marsh complexes where traditional surveys become cost-prohibitive. Ongoing refinements incorporate machine-learning classifiers trained on multi-date imagery so that predictions of species richness can be updated automatically as new tidal-cycle data arrive.
Conclusion
Color-shift monitoring across tidal cycles supplies an objective, repeatable layer of information that complements traditional biodiversity inventories in coastal marshes, and continued refinement of sensor calibration together with expanded geographic coverage will strengthen its utility for locating and protecting high-value sedge habitats.